Impact
The travel sector is an integral part of the City of Coronado’s economy. Group visitors, in particular, generate significant economic benefits to households, businesses, and government alike and represent a critical driver of the city’s future.
Group Travel Impact
With Coronado experiencing a strong recovery predominately in 2022, 2023 was a year that marked ongoing growth albeit at a slower pace than the year prior. Overall group visitor spending surpassed 2018 levels while total group visitors remained slightly below 2018 levels.
In 2023, groups spent $117.5 million in direct visitor spending, generating a total economic impact of $170.3 million in the City of Coronado. This total economic impact sustained 989 jobs and generated $8.4 million in local tax revenues in 2023.



$117.5
Direct Visitor Spending

$170.3M
Total Economic Impact

989
Total Jobs Generated

$8.4M
State & Local Tax Generated
Group Volume Trends & Hotel Performance
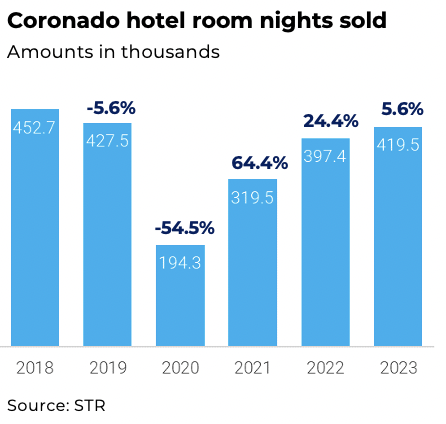
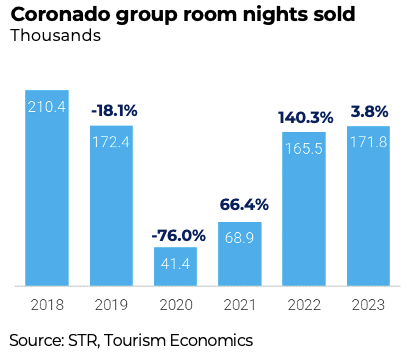
Travel demand to the City of Coronado peaked in 2018, with 452.7 thousand hotel room nights sold, 210.4 thousand of which were from the group travel segment. Hotel room demand, and group room demand in particular, experienced a moderate contraction in 2019 due to limited meeting space availability during hotel renovations.
The global pandemic induced a severe travel decline in 2020, and while leisure travel re-emerged in 2021, the group travel recovery did not begin in earnest until 2022, resulting in record high group room revenue.
Hotel Room Demand
Coronado room nights sold improved 5.6% in 2023, posting an increase of approximately 22,000 room nights sold.
Transient Occupancy Tax (TOT)
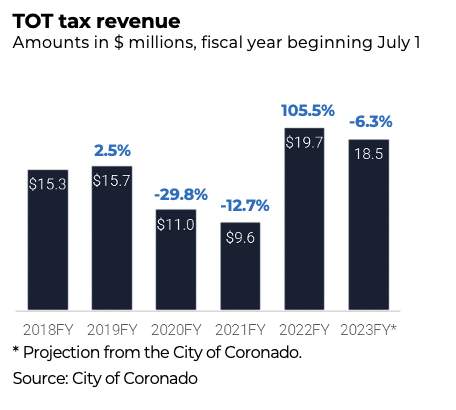
TOT revenue expanded 105.5% for fiscal year 2022 and reached $19.7 million, surpassing fiscal year 2019 for the first time.
The City of Coronado projects TOT revenue for the 2023 fiscal year to reach $18.5 million due to planned renovations at some of the hotel properties.
Room Demand Segmentation
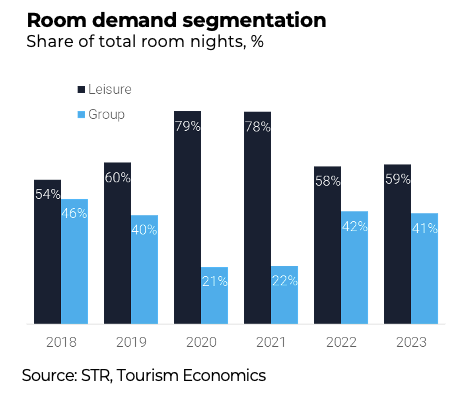
The share of group nights sold declined to 41% in 2023, after reaching 42% in 2022.
While the share of group room nights sold in 2023 exceeded its 2019 shares, extensive renovations at hotel properties hindered group travel in 2019. The share of group room nights sold in 2023 remained slightly below its 2018 peak at 46%.
Occupancy Segmentation
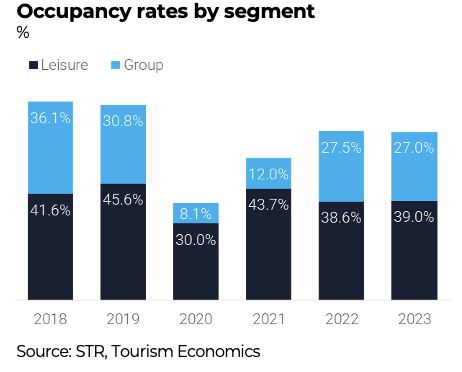
The overall occupancy rate was 66.1% in 2023, which was roughly on par with 2022 levels but remained below 2018 levels.
Group occupancy declined by 0.5 percentage points in 2023. This can be attributed to supply restraints for hotel rental space in certain hospitality properties.
Leisure occupancy increased its share of occupancy by 0.4 percentage points bringing its total occupancy to 39%.
Monthly Performance
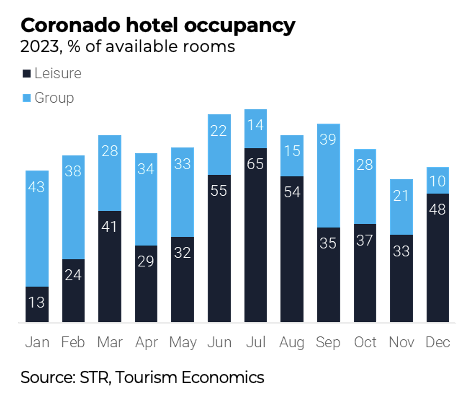
Group occupancy in the opening of 2023 returned to being a vital component of off-season travel.
Group travel became a smaller share of room occupancy with the return of summer leisure travel.
However, group travel was negatively impacted in Q3 and Q4 due to venue supply restraints at properties and weather. As a result, the fourth quarter of the year saw group hotel occupancy decline.
Group Performance
Group room nights rose 3.8% in 2023. With group room demand’s recovery in 2022, growth exhibits pre-pandemic behavior with steady marginal year over year growth.
Group room demand in 2023 remained 18% below its record high mark in 2018.
Group Revenue
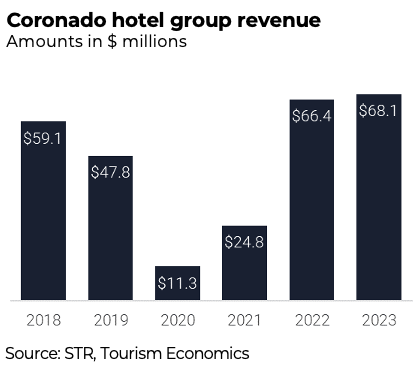
Group room revenue tallied $68.1 million in 2023 – a $1.7 million increase from the year prior.
Even as group room demand remained slightly behind its prior levels, elevated ADR pushed group room revenue to a new all-time high – exceeding its 2018 level by 15.3%.
Group Visitor Profile
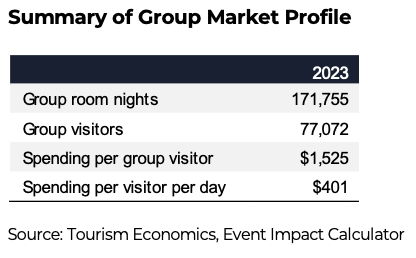
Coronado hosted more than 77,000 group hotel visitors in 2023, an increase of 3.5% over the prior year, yet still 19% below 2018. These visitors and their associated event spending provided $1,525 per visitor, and on average, $401 per visitor per day.
Despite the strong recovery in group travel in 2022 and continued, albeit modest, growth in 2023, group visitors remained below 2018 levels. However, price increases coupled with demand pushed total group visitor spending to exceed 2018 levels.
Business meetings continued to drive the recovery of group room nights, which registered 98% of 2018 levels in 2023. Convention room nights remained below 2018 levels with 45% of 2018 room night levels. Incentive / social gatherings declined in 2023, registering just 93% of 2018 levels, likely a result of much pent-up demand being experienced in 2022 for social events such as weddings that would have occurred in 2020 and 2021.

Group Economic Impact
Groups spent $117.5 million in direct visitor spending in 2023.
The 171,755 group room nights in 2023 generated $68.1 million in lodging spending and $117.5 million in total visitor spending. This includes visitor spending on transportation, restaurants, retail, recreation, and other services.
Including the supply chain (indirect impacts) and the local spending of earned income (induced impacts), groups generated $170.3 million in economic activity in the City of Coronado in 2023.
This includes $60.7 million in household income (wages and benefits) and 989 jobs across the Coronado economy. Groups also generated $8.4 million in local taxes and assessments.
Economic Impacts in Context

$117.5M Group Sales
The $117.5 million in group sales means that nearly $322,000 was spent EVERY DAY by in group visitors in the City of Coronado.

$60.7M Labor Income
The $60.7 million in total income generated by groups is the equivalent of nearly $9,200 for every household in the City of Coronado.

989 Total Jobs
The number of jobs sustained by tourism (989) supports 11.4% of all jobs in the City of Coronado.

$8.4M Local Taxes
Each household in the City of Coronado would need to be taxed an additional $1,300 to replace the visitor taxes received by the local government in 2023.